The following is the activity diagram for the Observer design pattern.
Compare this behavioural diagram with the structural diagram for the Observer design pattern:
Lecture recording here.
Lab recording here.
This week we continue our study on high-level design. We will look at reports, database design, configuration and data flow. We will also look at UML, structure, behaviour and interaction diagrams.
Lab 1: The Digital Audio Workstation
Lab 2: The Dubai Offices of Barakat Publishing
To review the operations of a simple server, see the code for the message pump from week 6 of SEP400:
msgClient.cpp,
msgPump.h,
msgPump.cpp,
msgPumpMain.cpp,
startClient.sh,
stopClient.sh and
Makefile.
Assignment 1: Analog Circuit Simulator
Database design is an important part of most applications, not just for data-centric architectures. The first part of database design is to decide what kind of database the program will need. You need to specify whether the application will store data in text files, XML files, a full-fledged relational database, or something more exotic such as a temporal database or object store. Even a program that doesn't use any database still needs to store data, perhaps inside the program within arrays, lists, maps, or some other data structure.
If you use a relational database, you can sketch out the tables it contains and their relationships during high-level design. Later you can provide more details such as the specific fields in each table and the fields that make up the keys linking the tables.
With the handling of data you have to consider the following: data modelling, data flow and architecture, data storage, data validation, data processing, data security, data presentation, and data backup and recovery.
An audit trail keeps track of each user who modifies a specific record. Later, management can use the audit trails to see which employee gave a customer a 120-percent discount. Auditing can be as simple as creating a history table that records a user's name, a link to the record that was modified, and the date when the change occurred. Some database products can even create audit trails for you.
A fancier version might store copies of the original data in each table when its data is modified. Later, you can compare the customer's records over time to build an audit trail that re-creates the exact sequence of changes made for that customer. Keeping a record of significant actions is important for security and accountability. These trails can also be used in behaviour analysis to improve your product.
Many applications also need to provide different levels of access to different kinds of data. One way to handle user access is to build a table listing the users and the privileges they should be given. The program can then disable or remove the buttons and menu items that a particular user shouldn't be allowed to use. Many databases can also restrict access to tables or even specific columns in tables. To coordinate user access, special attention has to be paid to authentication (validate the user) and authorization (control what the user has access to). Your higher level software should incorporate user registration and profile management features, allowing users to create accounts, update their profiles, and request a change to their authentication credentials.
The following not only applies to databases, but any form of data-centric storage and management such as text files, XML files, arrays, lists, maps, or some other data structure.
A database is like a hall closet: Over time it gets disorganized and full of random junk like string, chipped vases, and unmatched socks. Every now and then, you need to reorganize so that you can find things efficiently. If you use audit trails and the records require a lot of changes, the database will start to fill up with old versions of records that have been modified. Even if you don't use audit trails, over time the database can become cluttered with outdated records.
In that case, you may want to move some of the older data to long-term storage to keep the main database lean and responsive. Depending on the application, you may also need to design a way to retrieve the old data if you decide you want it back later. You can move the older data into a data warehouse, a secondary database that holds older data for analysis. In some applications, you may want to analyze the data and store modified or aggregated forms in the warehouse instead of keeping every outdated record. You may even want to discard the old data if you're sure you'll never need it again.
Removing old data from a database can help keep it responsive, but a lot of changes to the data can make the database's indexes inefficient and that can hurt performance. For that reason, you may need to periodically re-index key tables or run database tuning software to restore peak performance. In large, high-reliability applications, you might need to perform these sorts of tasks during off-peak hours such as between midnight and 2 a.m.
Finally, you should design a database backup and recovery scheme. In a low-priority application, that might involve copying a data file to a DVD every now and then. More typically, it means copying the database every night and saving the copy for a few days or a week. For high-reliability systems, it may mean buying a special-purpose database that automatically shadows every change made to any database record on multiple computers.
You can reduce your workload if you provide configuration screens so that users can fine-tune the application without making you write new code. Store parameters to algorithms, key amounts, and important durations in the database or in configuration files. Make sure that only the right users can modify the parameters. In many applications, only managers should change these values.
There is more to configuration than configuration screens. Configuration data emcompasses settings, parameters, and options that control the behavior and functionality of the application, as follows:
Data flow refers to the movement and transformation of data within a software system. It involves
identifying how data enters the system, how it is processed or manipulated, and how it ultimately exits the system.
Many applications use data that flows among different processes. You can think of a piece of data as moving through
a sequence of states. The states often correspond to the processes in the related data flow. Sometimes events can
make the data take different paths through the system. Diagrams help describe the system and the way processes
interact with the data, such as the diagrams below:
Data flow begins by identifying the sources of data that the software interacts with. These sources can include user input, external APIs, databases, sensors, files, streaming data, and more. The processing of this data can include data transformation, validation, computation, decoding, decompression,... Designers have to decide whether any of the data should be stored, when and where. It is very likely that this data will have to be transmitted, or forwarded on to a recipient. Outputs can included user interfaces, reports, files, data sent to other systems,... In complex systems, data may flow through multiple paths and undergo various transformations before reaching its final destination. Data routing and transformation logic need to be defined to ensure data reaches the intended destination in the desired format. In transmitting data, concurrency and parallelism should be considered. Some parts of the data can be sent independent of other parts. Error control coding should be used for lossy systems. Encryption of the data should also be used for security.
Although it may not be time to start writing training materials, it's never too early to think about them. The details of the system will probably change a lot between high-level design and fi nal installation, but you can at least think about how you want training to work. You can decide whether you want users to attend courses taught by instructors, read printed manuals, watch instructional videos, or browse documentation online. Trainers may create content that discusses the application's high-level purpose, but you have to fill in most of the details later as the project develops.
The Unified Modeling Language (UML) isn't actually a single unified language. Instead it defines several kinds of diagrams that you can use to represent different pieces of the system.
UML 2.0 defines 13 diagram types divided into three categories (and one subcategory) as shown in the following list:
A structure diagram describes things that will be in the system you are designing. For example, the class diagram (one type of structure diagram) shows relationships among the classes that will represent objects in the system such as inventory items, vehicles, expense reports, and coffee requisition forms. The following list summarizes UML's structure diagrams:
The most basic of the structure diagrams is the class diagram. In a
class diagram, a class is represented by a rectangle. The class's name
goes at the top, is centered, and is in bold. Two sections below the
name give the class's properties and methods. Symbols are added
to the left of a class member to show its visibility within the project, as shown below:
Class diagrams also often show relationships among classes. Lines connect classes that are related
to each other. A variety of line styles, symbols, arrowheads, and annotations give more information
about the kinds of relationships. The simplest way to use relationships is to draw an arrow indicating the direction of the relationship
and label the arrow with the relationship's name. At the line's endpoints, you can add symbols to indicate how many objects are involved in the
relationship. The following table shows symbols you can add to the ends of a relationship.
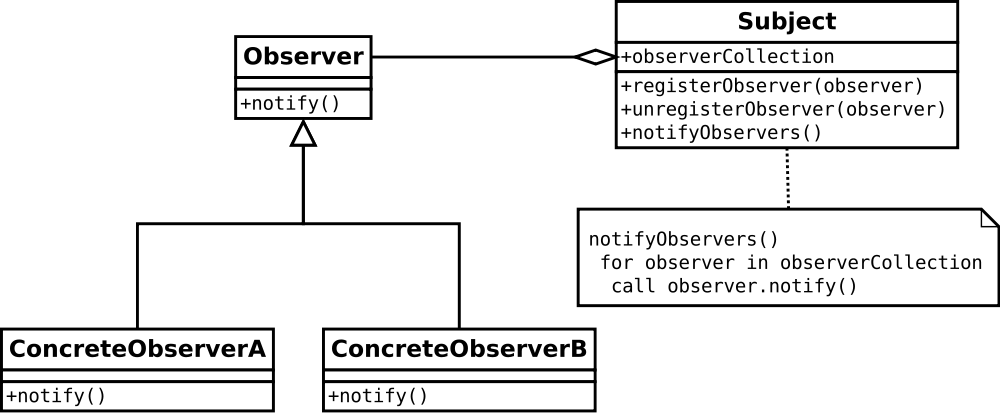
Another important type of class diagram relationship is inheritance. In object-oriented programming, one class can inherit the properties and methods of another. In a class diagram, you indicate inheritance by using a hollow arrowhead pointing from the child class to the parent class.
Class diagrams for complicated applications can become cluttered and hard to read if you put
everything in a single huge diagram. To reduce clutter, developers often draw multiple class
diagrams showing parts of the system. In particular, they often make separate diagrams to show
inheritance and other relationships. An example of a class diagram is given below:
UML defines three kinds of basic behavior diagrams : activity diagrams, use case diagrams, and state machine diagrams.
An activity diagram represents work flows for activities. They include several kinds of symbols
connected with arrows to show the direction of the work flow. The below table summarizes the symbols:
An activity diagram is a bit like a flowchart showing how work flows. The following is an example
of an activity diagram:
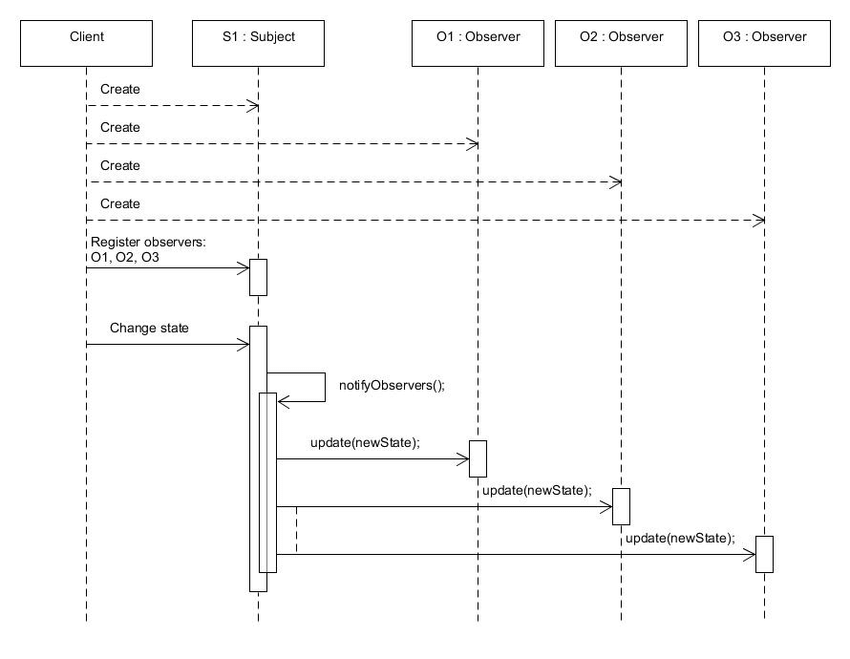
The following is the activity diagram for the Observer design pattern.
Compare this behavioural diagram with the structural diagram for the Observer design pattern:
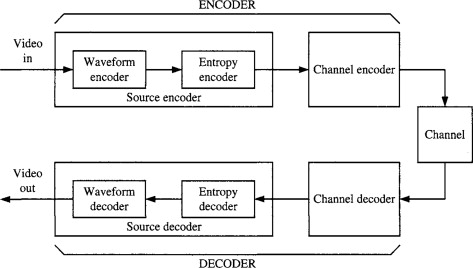
Below is an activity diagram for a video encoder/decoder:
A use case diagram represents a user's interaction with the system. Use case diagrams show stick figures representing actors (someone or something that performs a task) connected to tasks represented by ellipses. To provide more detail, you can use arrows to join subtasks to tasks. Use the annotation <<include>> to mean the task includes the subtask. (It can't take place without the subtask.) If a subtask might occur only under some circumstances, connect it to the main task and add the annotation <<extend>> . If you like, you can add a note indicating when the extension occurs. (Usually both <<include>> and <<extend>> arrows are dashed.)
The below shows a simple online shopping use case diagram:
A state machine diagram shows the states through which an object passes in response to various events. States are represented by rounded rectangles. Arrows indicate transitions from one state to another. Sometimes annotations on the arrows indicate what causes a transition. A black circle represents the starting state and a circled black circle indicates the stopping state.
The below shows a state machine for reading a floating point number. Here the program starts and can
read a digit, +, or -. (If it reads any other character, the machine fails
and the program would need to take some action, such as displaying an error message.) If it reads a
+, or -, the machine moves to the state "Digit before decimal." Etc...
As an exercise, let us build a two-phase non-overlapping clock generator from a one-phase clock
using state machines. The output of a two-phase non-overlapping clock generator can be seen below:
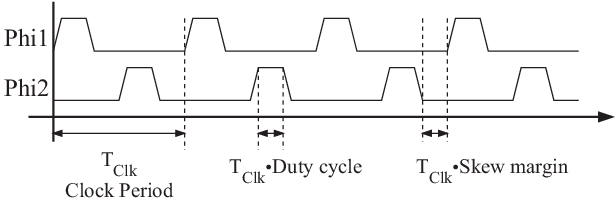
The following document explains the design of a two phase non-overlapping clock generator using a
state machine diagram: A Two-Phase Non-Overlapping Clock Generator.
The following code implements a simple traffic light as a state machine with three states: red, green and yellow. See TrafficLight.cpp. Although the example is simple, the concepts can be applied for complex state machines with function pointers associated with each state.
See 8-bit Processor Finite State Machine Design for a finite-state machine for an 8-bit processor. Observe the state transitions for the assembly language instruction STM (store accumulator to memory).
See also Microcontroller State Machine Implementation for a discussion on a microcontroller connected to an LED (light emitting diode).
Interaction diagrams are a subset of activity diagrams. They include sequence diagrams, communication diagrams, timing diagrams, and interaction overview diagrams.
A sequence diagram shows how objects collaborate in a particular scenario. It represents the collaboration as a sequence of messages. Objects participating in the collaboration are represented as rectangles or sometimes as stick fi gures for actors. They are labeled with a name or class. If the label includes both a name and class, they are separated by a colon. Below each of the participants is a vertical dashed line called a lifeline . The lifeline basically represents the participant sitting there waiting for something to happen. An execution specifi cation (called an execution or informally an activation n ) represents a participant doing something. In the diagram, these are represented as gray or white rectangles drawn on top of the lifeline. You can draw overlapping rectangles to represent overlapping executions. Labeled arrows with solid arrowheads represent synchronous messages. Arrows with open arrowheads represent asynchronous messages. Finally, dashed arrows with open arrowheads represent return messages sent in reply to a calling message.
The below shows a customer, a clerk, and the Movie class interacting to print a ticket for a movie:
Like a sequence diagram, a communication diagram shows communication among objects during some sort of collaboration. The difference is the sequence diagram focuses on the sequence of messages, but the communication diagram focuses more on the objects involved in the collaboration. The diagram uses lines to connect objects that collaborate during an interaction. Labeled arrows indicate messages between objects. The messages are numbered that so you can follow the sequence of messages.
The following is a communication diagram for buying a movie ticket:
A timing diagram shows one or more objects' changes in state over time. A timing diagram looks a lot like a sequence diagram turned sideways, so time increases from left to right. These diagrams can be useful for giving a sense of how long different parts of a scenario will take. More elaborate versions of the timing diagram show multiple participants stacked above each other with arrows showing how messages pass between the participants.
An interaction overview diagram is basically an activity diagram where the nodes can be frames that contain other kinds of diagrams. Those nodes can contain sequence, communication, timing, and other interaction overview diagrams. This lets you show more detail for nodes that represent complicated tasks.
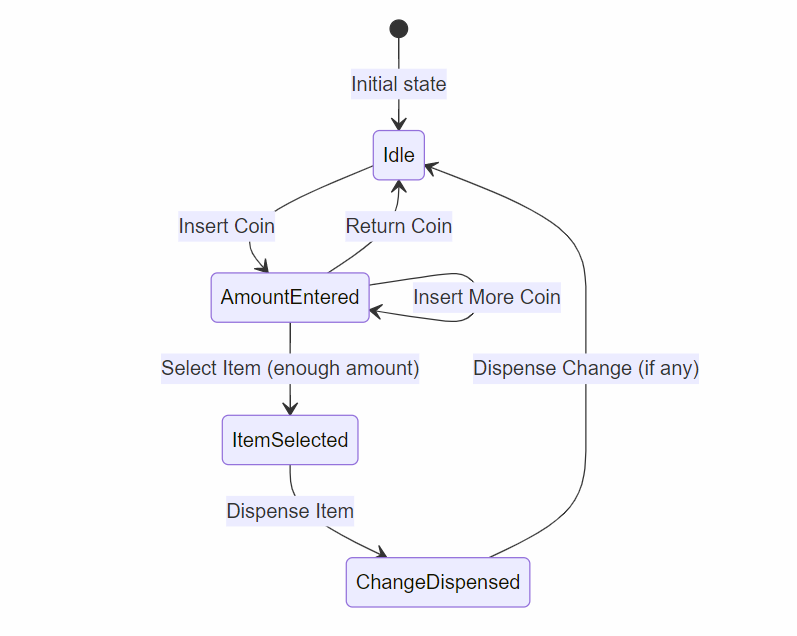
Sample Code - The Vending Machine
The following code takes us through the various stages of a vending machine. This code uses
maps to connect function pointers to states.
VendingMachine.cpp.
The states can be seen below:
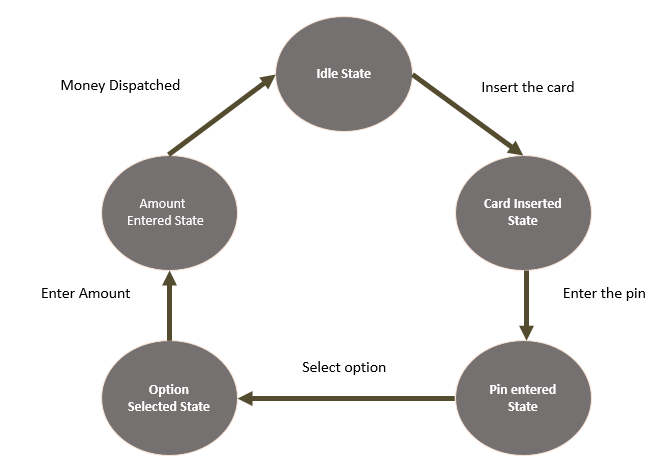
Sample Code - An ATM Machine
The following code takes us through the states of an ATM machine. This codes uses a switch
block to connect function pointers to states.
ATM1.cpp.
The states can be seen below:
Sample Code - An ATM Machine, second implementation
The following code takes us through the states of the same ATM machine. Functions
are connected to states through an array of function pointers.
ATM2.cpp.